Reply to Giaever
Points made by Ivar Giaever at a 2010 speech
https://www.youtube.com/watch?v=SXxHfb66ZgM
____________________________________________________________________
global warming sites:
http://planetsave.com/2010/08/13/119-one-liners-to-respond-to-climate-science-myths/
https://www.youtube.com/watch?v=evOy3e4tNQU&feature=youtu.be&t=16m58s
http://www.skepticalscience.com/argument.php
__________________________________________________________________
notes and paraphrazing:
*"Global Warming has become a new religion" because you can't discuss it.
[Reply: what about whether there was a holocaust? or whether sex with children should be a crime? These "can't be discussed" either.
Is it because belief that there was a holocaust and molesting children is evil is a "religion"?
or that appeals to "an open mind" on some issues are just too creepy?
When fossil fuel industry billionaires are spending money to influence the political discussion and succeeding, scientists get touchy.]
*Average temperature of the earth increased 0.8 degrees change too little, over 150 years, not even fever space and time for problems
*Is it possible to measure global surface temperature over space in time over whole year "I don't believe anybody can measure that. its impossible to measure that" thermometers were moved several times.
Reply: "Unfortunately this simply displays an ignorance regarding the surface temperature record, whose accuracy has been confirmed time and time again, and which is also consistent with lower troposphere temperature measurements, as illustrated in Figure 1.
Glenn Tramblyn has answered Giaever's question in great detail in his four part series Of Averages & Anomalies, and Kevin C also had an excellent and detailed post on recent temperature measurements in The GLOBAL global warming signal.
*what does the curve mean? probably nothing. 288K to 288.8 K (0.3% change) amazingly stable.
*1975 to 1998 and CO2 and temperature changed in common also
*water vapor is a much much stronger green house gas.
REPLY: Yes water vapour is the most dominant greenhouse gas. But it come and goes. When the temperature drops it goes -- as rain and snow. When it global surface gets hot the atmosphere hold much more vapour. So it amplifies the affect of CO2. (one reason why small amounts of CO2 make such a difference).
For a graph showing water vapor is increasing: https://www.climate.gov/news-features/understanding-climate/2012-state-climate-humidity
"Water vapour is the most dominant greenhouse gas. Water vapour is also the dominant positive feedback in our climate system and amplifies any warming caused by changes in atmospheric CO2. This positive feedback is why climate is so sensitive to CO2 warming. http://planetsave.com/2010/08/13/119-one-liners-to-respond-to-climate-science-myths/
"the level of water vapor in the atmosphere is a function of temperature. Water vapor is brought into the atmosphere via evaporation - the rate depends on the temperature of the ocean and air. If extra water is added to the atmosphere, it condenses and falls as rain or snow within a week or two" Ivar Giaever - Nobel Winning Physicist and ClimatePseudoscientist
*hockey stick graph
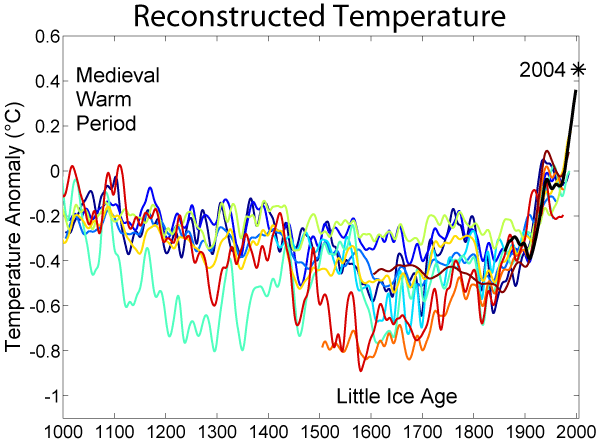
This image is a comparison of 10 different published reconstructions of mean temperature changes during the 2nd millennium. More recent reconstructions are plotted towards the front and in redder colors, older reconstructions appear towards the back and in bluer colors. An instrumental history of temperature is also shown in black. The medieval warm period and little ice age are labeled at roughly the times when they are historically believed to occur, though it is still disputed whether these were truly global or only regional events. The single, unsmoothed annual value for 2004 is also shown for comparison. (Image:Instrumental Temperature Record.png shows how 2004 relates to other recent years). It is unknown which, if any, of these reconstructions is an accurate representation of climate history; however, these curves are a fair representation of the range of results appearing in the published scientific literature. Hence, it is likely that such reconstructions, accurate or not, will play a significant role in the ongoing discussions of global climate change and global warming. For each reconstruction, the raw data has been decadally smoothed with a σ = 5 yr Gaussian weighted moving average. Also, each reconstruction was adjusted so that its mean matched the mean of the instrumental record during the period of overlap. The variance (i.e. the scale of fluctuations) was not adjusted (except in one case noted below). Except as noted below, all original data for this comparison comes from here and links therein. It should also be noted that many reconstructions of past climate report substantial error bars, which are not represented on this figure.

see also: https://www.theatlantic.com/technology/archive/2013/05/the-hockey-stick-the-most-controversial-chart-in-science-explained/275753/
*hockey stick graph
CO2 not the cause.
earth population is the cause.
Paved roads and cut down trees are the cause not CO2. Nobody talks about.
reply: https://thebreakthrough.org/index.php/programs/energy-and-climate/limiting-population-growth-is-not-the-answer-to-global-warming
A) population growth is decreasing
"In 1970 only seven countries had fertility rates below two babies per woman. However by 2012 this has risen to seventy-four countries. In fact added together the countries with below replacement level fertility represent approximately half of humanity, and the median fertility rate has changed from 5.5 to 2.2 babies per woman between 1970 and 2012."
B) Bullshit. They (global warming environmentalist scientists) are talking about that. Google "is population growth causing global warming?" and you get this:
`According to the Worldwatch Institute, a nonprofit environmental think tank, the overriding challenges facing our global civilization are to curtail climate change and slow population growth. “Success on these two fronts would make other challenges, such as reversing the deforestation of Earth, stabilizing water tables, and protecting plant and animal diversity, much more manageable,” reports the group.` https://www.scientificamerican.com/article/population-growth-climate-change/
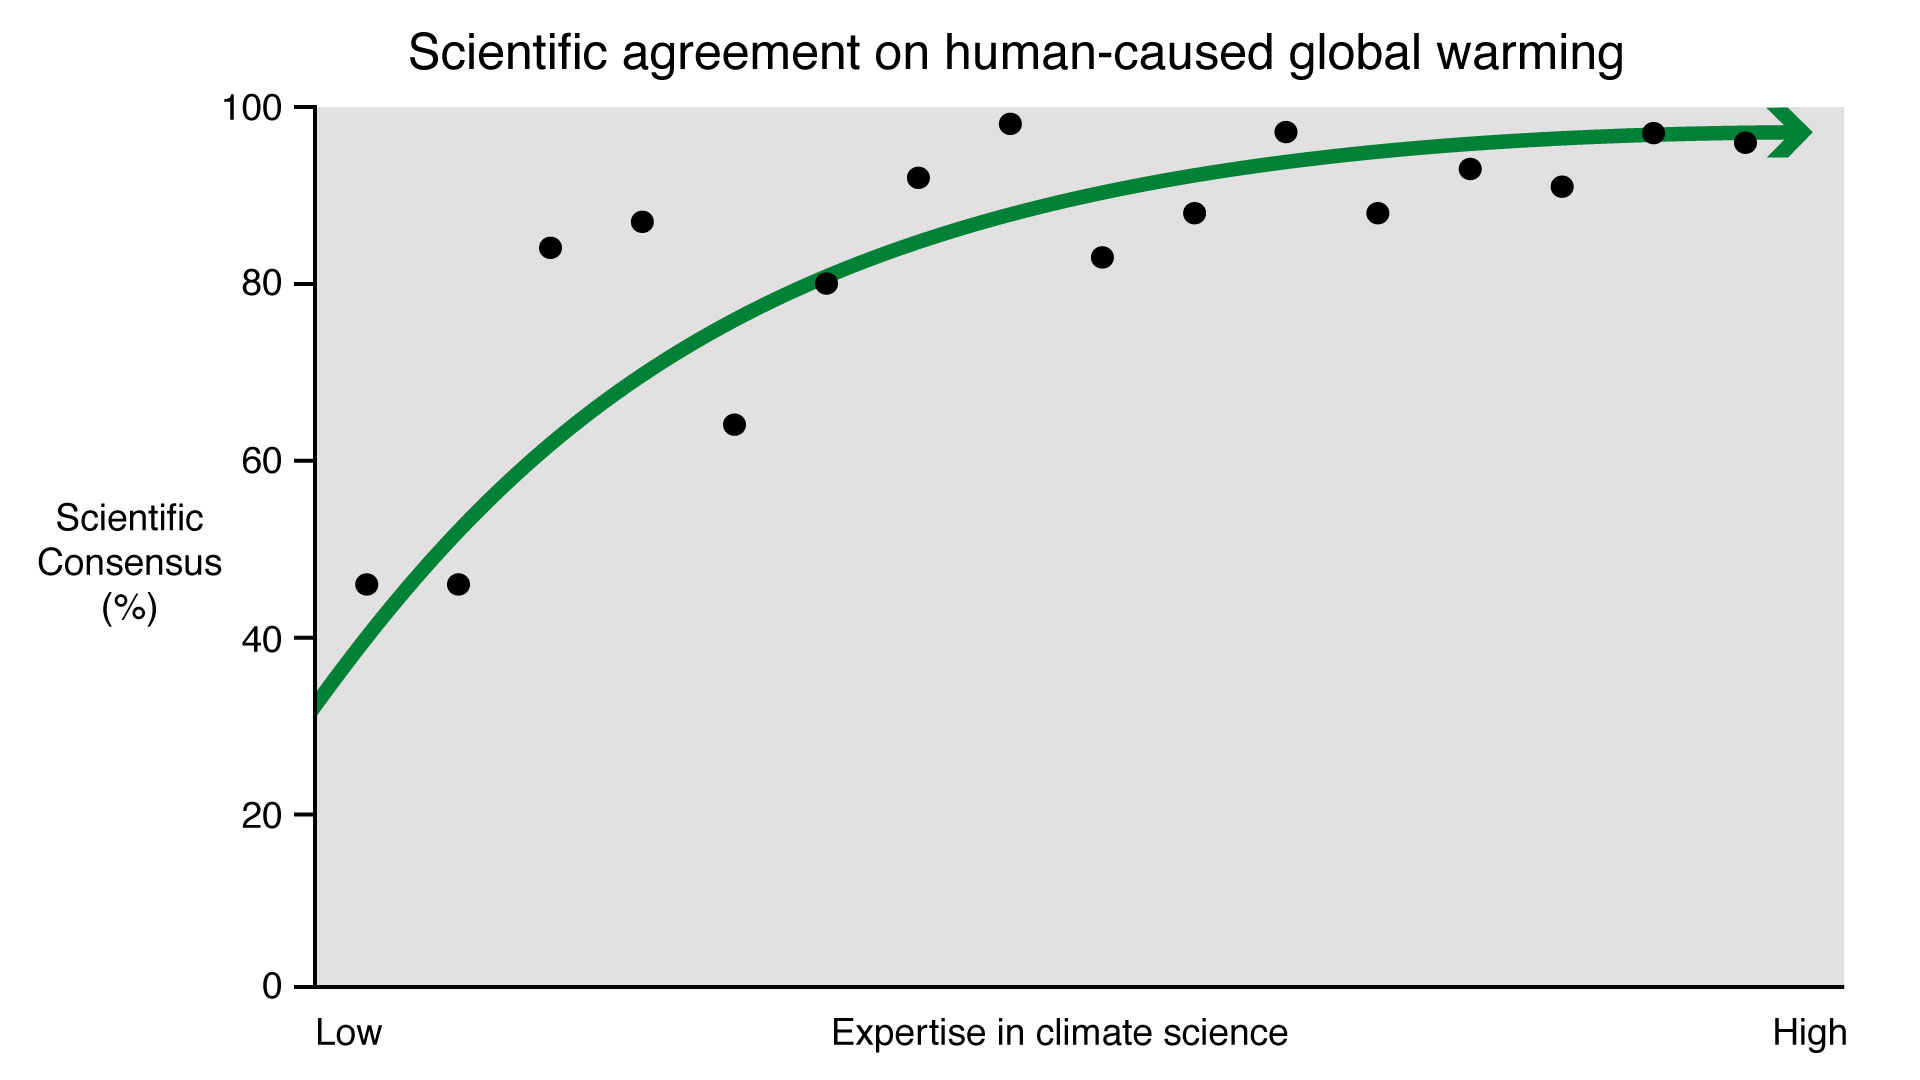
*Copenhagen American Physical Society global warming is incontrovertible. resigned from the society in protest.
Reply: So how solid a consensus is there on human caused global warming?
*Earth is much better than 150 years ago. Longevity, nutrition, per capita income ...
*"Oxfam report showed that 21,000 people suffered weather-related deaths during the first nine months of 2010, more than twice the number for the whole of 2009." propaganda
*Rio conference sustainable development.
*Greenhouse effect CO2 has increased from 280 ppm to 380 ppm in about 100 years. Temperature has increased about 0.8 C. Is there a cause and an effect?
in 14 years since 1998, CO2 is now 396 ppm . But 1998 was the warmest year on record and years since have been colder. should be warmer.
Comment: since 2012 when Ivar Giaever made this presentation, https://www.climate.gov/news-features/understanding-climate/climate-change-global-temperature 2015 and 2016 significantly warmer than 1998.

*measuring temperature there are only 8 thermometers in Antarctic. "How can they talk about average temperature? I don't understand it."
*What is the optimal temperature? nobody knows. It's not what it is now.
*Will temperature rise hurt farming? say it will in Africa but what about Iowa? Ethanol is terrible for the country. More CO2 better for plant life
*Body size shrink because of global warming everything from cotton to scallops, shrimp, birds, squirrels, ...
*everything is caused by global warming so lets talk about climate change. when did climate change? always to the worse why not better. Changes have always happened. Dust bowl. Greenland is melting
*list of how high sea level will rise if:
**all glaciers in world melt - 1 meter rise
**Greenland melts - 7 meter rise
**antarctica melts - 93 meter rise
*There is more ice in the antartica then there ever has been. because it is colder. Southern hemisphere is getting colder.
*ice in Greenland in last 11 years has risen 5 cm/year in inland of Greenland. You see pictures of coast. More ice in Greenland than 15 years ago. 5 warmest years on Greenland were in the 1940s. coolest years in 1980s 1990s.
REPLY: https://skepticalscience.com/greenland-cooling-gaining-ice-intermediate.htm "While the Greenland interior is in mass balance, the coastlines are losing ice. Overall Greenland is losing ice mass at an accelerating rate. From 2002 to 2009, the rate of ice mass loss doubled..... , warmer temperatures also cause more snow to fall in Greenland's interior. https://www.youtube.com/watch?v=evOy3e4tNQU&feature=youtu.be&t=16m58s when the fringes of iceland melt the interior lowers. When the interior lowers its temperature drops (high elevation is colder) when temperature drops it melts too.

Greenland 2007 melt anomaly, measured as the difference between the number of days on which melting occurred in 2007 compared to the average annual melting days from 1988–2006[62] [no longer found on NOAA site]
*Extreme weather. 100 year floods happen every 100 years.
*Alarmism about hurricanes. Lots of hurricanes one year and claimed to be a harbinger of global warming. Next year none and nobody says anything.
*Has the sea level risen because of global warming? Risen 15 meters in 8 thousand years 21:57 but recently has risen "20cm in a hundred years" (and very steadily). and not changed recently. There have been "no unusual rise of sea level." 22:26
Reply: Globally, eight of the world's 10 largest cities are near a coast, according to the U.N. Atlas of the Oceans. .... In the United States, almost 40 percent of the population lives in ... coastal areas http://oceanservice.noaa.gov/facts/sealevel.html
*polar bear is running out of ice. but in Svaldbad (Spitzbergen) there were about 1000 polar bears in 1972. "Since then bears have been protected and population has increased to ~4000 in 2005." 23:14
More seals for polar bears to eat. (more important than cold weather.
REPLY: While the Greenland interior is in mass balance, the coastlines are losing ice. Overall Greenland is losing ice mass at an accelerating rate. From 2002 to 2009, the rate of ice mass loss doubled. Seals require ice for habitat.
*Atmosphere is much, much bigger than you think it is. consider a 20ft by 20ft by 10 ft room. "How many matches would you need to burn to duplicate the CO2 of cars in the atmosphere? answer: one match in a year!. 25:13
*Everyday you breath out 800 grams of CO2. 400 kg a year.but there's much more CO2 with your use of cars, etc.
*Why not limit population to fight global warming? too unpopular.
*"Greens want this solution": windmills in California "I shudder because I see my tax money go out the window." Nuclear power plants "are the right solution". ("I know about the tsunami in Japan". "not a single person died from radiation" out of the 100,000 killed)
*"You feel good using solar cells ... WASTING your money"
*1900 problem in New York city: "How can we get enough horses?"
*"The earth is changing. things are changing for heavens sake?" The policy of the united states to keep things unchanged because we have it good in the United States. (30:19) We have to live with change.
*antarctic ice core. Roughly every 100,000 years we get an ice age. "Looks like we are ready for another ice age". We just have to deal with change
*but temperature rises before CO2 increases. try to explain it away. but these are the facts.
"Is global science a pseudoscience? ... absolutely!"
Comments
Post a Comment